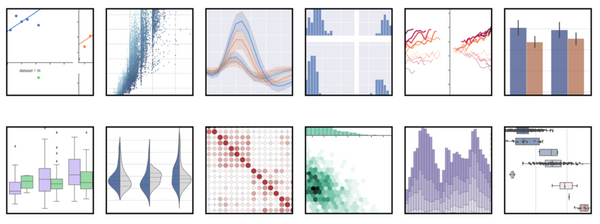
Just gonna put this out here, courtesy of Kaggle's Data Visualization course
[https://www.kaggle.com/learn/data-visualization].
It is a super simple description of the different plots you can do with Seaborn
[https://seaborn.pydata.org/], simply divided into the type of story you're
trying

